Qlearning
QLearning是强化学习算法中value-based的算法,Q即为Q(s,a)就是在某一时刻的 s 状态下(s∈S),采取 动作a (a∈A)动作能够获得收益的期望,环境会根据agent的动作反馈相应的回报reward r,所以算法的主要思想就是将State与Action构建成一张Q-table来存储Q值,然后根据Q值来选取能够获得最大的收益的动作。
import numpy as np
import matplotlib.pyplot as plt
%matplotlib inline
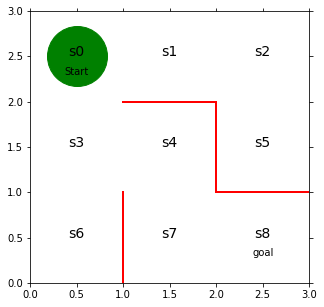
fig = plt.figure(figsize = (5,5))
ax = plt.gca()
plt.plot([1,1],[0,1],color = 'red',linewidth=2)
plt.plot([1,2],[2,2],color = 'red',linewidth=2)
plt.plot([2,2],[2,1],color = 'red',linewidth=2)
plt.plot([2,3],[1,1],color = 'red',linewidth=2)
plt.text(0.5,2.5,'s0',size = 14,ha = 'center')
plt.text(1.5,2.5,'s1',size = 14,ha = 'center')
plt.text(2.5,2.5,'s2',size = 14,ha = 'center')
plt.text(0.5,1.5,'s3',size = 14,ha = 'center')
plt.text(1.5,1.5,'s4',size = 14,ha = 'center')
plt.text(2.5,1.5,'s5',size = 14,ha = 'center')
plt.text(0.5,0.5,'s6',size = 14,ha = 'center')
plt.text(1.5,0.5,'s7',size = 14,ha = 'center')
plt.text(2.5,0.5,'s8',size = 14,ha = 'center')
plt.text(0.5,2.3,'Start',ha = 'center')
plt.text(2.5,0.3,'goal',ha = 'center')
ax.set_xlim(0,3)
ax.set_ylim(0,3)
plt.tick_params(axis='both',which='both',bottom='off',top='off',labelbottom='off',right='off',left='off',labelleft='off')
line, = ax.plot([0.5],[2.5],marker="o",color="g",markersize=60)
theta_0 = np.array([[np.nan,1,1,np.nan],
[np.nan,1,np.nan,1],
[np.nan,np.nan,1,1],
[1,1,1,np.nan],
[np.nan,np.nan,1,1],
[1,np.nan,np.nan,np.nan],
[1,np.nan,np.nan,np.nan],
[1,1,np.nan,np.nan]])
# 初期设定数组 数组的行列的设定值与 theta_0相同
[a,b] = theta_0.shape
# np.random.rand()使用这个函数可以返回一个或者一组服从“0-1”均匀分布的随机样品值
Q = np.random.rand(a,b)*theta_0def simple_convert_pi_from_theta(theta):
[m,n] = theta.shape
pi = np.zeros((m,n))
for i in range (0,m):
pi[i,:] = theta[i,:]/np.nansum(theta[i,:])
pi = np.nan_to_num(pi)
return pi
pi_0 = simple_convert_pi_from_theta(theta_0)def get_action(s,Q,epsilon,pi_0):
direction = ["up","right","down","left"]
if np.random.rand()<epsilon:
next_direction = np.random.choice(direction,p = pi_0[s,:])
else:
# np.nanargmax 是求配列中最大值的方法 这个把nan忽视掉
# 如果是np.argmax 的话nan是当作最大值
next_direction = direction[np.nanargmax(Q[s,:])] #这里求的是最大值的索引
if next_direction == "up":
action = 0
elif next_direction == "right":
action = 1
elif next_direction == "down":
action = 2
elif next_direction == "left":
action = 3
return action
def get_s_next(s,a,Q,epsilon,pi_0):
direction = ["up","right","down","left"]
next_direction = direction[a]
if next_direction == "up":
s_next = s-3
elif next_direction == "right":
s_next = s+1
elif next_direction == "down":
s_next = s+3
elif next_direction == "left":
s_next = s-1
return s_nextdef Q_learning(s,a,r,s_next,Q,eta,gamma):
if s_next == 8:
Q[s,a] = Q[s,a]+eta*(r-Q[s,a])
else:
Q[s,a] = Q[s,a]+eta*(r+gamma*np.nanmax(Q[s_next,:]) - Q[s,a])
#这里np.nanmaxQ[s_next,:]是取四个行动(0,1,2,3)中Q价值最大动作
return Q
def goal_maze_ret_s_a_Q(Q,epsilon,eta,gamma,pi):
s = 0
a = a_next = get_action(s,Q,epsilon,pi)
s_a_history = [[0,np.nan]]
while(1):
a = a_next
# 将行动代入当前状态 当前s_a_history只有一个状态行动 代入行动 之后每次都对最后一次的状态进行操作
s_a_history[-1][1] = a
s_next = get_s_next(s,a,Q,epsilon,pi)
# 状态代入 行动不知道np.nan
s_a_history.append([s_next,np.nan])
if s_next ==8:
# 到达终点报酬
r =1
a_next = np.nan
else:
r =0
a_next = get_action(s_next,Q,epsilon,pi)
#价值函数更新
Q = Q_learning(s,a,r,s_next,Q,eta,gamma)
if s_next == 8:
break
else:
s = s_next
return [s_a_history,Q] # 这里一定要注意缩进 条件语句之后执行结束后 将s_a_history输出
[a,b] = theta_0.shape
Q = np.random.rand(a,b) *theta_0* 0.1
# 学习率eta 时间折旧gamma
# ε-greedy 初期值0.5
eta = 0.1
gamma = 0.9
epsilon = 0.5
# 每个状态下价值Q的最大值
v = np.nanmax(Q,axis = 1)
is_continue = True
episode =1
V = []
V.append(np.nanmax(Q,axis = 1))
while is_continue:
print("episode:"+ str(episode))
epsilon = epsilon/2 #epsilon越小说明随机选择概率越小 Q最大值选择概率越大
[s_a_history,Q] = goal_maze_ret_s_a_Q(Q,epsilon,eta,gamma,pi_0)
new_v = np.nanmax(Q,axis =1)
print(np.sum(np.abs(new_v - v)))
v = new_v
V.append(v)
print("迷路问题解决需要step" +str(len(s_a_history)-1))
episode = episode +1
if episode >100:
break
episode:1
0.22862197060646997
迷路问题解决需要step446
episode:2
0.10822810474180004
迷路问题解决需要step126
episode:3
0.09478925672666577
迷路问题解决需要step10
episode:4
0.09316359830793433
迷路问题解决需要step4
episode:5
0.09218509281504522
迷路问题解决需要step4
episode:6
0.09117946265700733
迷路问题解决需要step4
episode:7
0.09013985857702625
迷路问题解决需要step4
episode:8
0.08905839616307487
迷路问题解决需要step4
episode:9
0.08792718721460428
迷路问题解决需要step4
episode:10
0.08673905078137753
迷路问题解决需要step4
.
.
.
episode:89
0.0013699715508602717
迷路问题解决需要step4
episode:90
0.001270445578285262
迷路问题解决需要step4
episode:91
0.0011778113705001036
迷路问题解决需要step4
episode:92
0.0010916235040459021
迷路问题解决需要step4
episode:93
0.00101146232569449
迷路问题解决需要step4
episode:94
0.0009369327553031548
迷路问题解决需要step4
episode:95
0.0008676631138282431
迷路问题解决需要step4
episode:96
0.0008033039797293862
迷路问题解决需要step4
episode:97
0.0007435270763960222
迷路问题解决需要step4
episode:98
0.0006880241927098574
迷路问题解决需要step4
episode:99
0.0006365061383794002
迷路问题解决需要step4
episode:100
0.0005887017352651513
迷路问题解决需要step4
from matplotlib import animation
from IPython.display import HTML
import matplotlib.cm as cm #color map
# IPython这是是大写
def init():
    line.set_data([],[])
    return (line,)
def animate(i):
    line, = ax.plot([0.5],[2.5],marker = "s",color = cm.jet(V[i][0]),markersize = 85) #s0
    line, = ax.plot([1.5],[2.5],marker = "s",color = cm.jet(V[i][1]),markersize = 85)
    line, = ax.plot([2.5],[2.5],marker = "s",color = cm.jet(V[i][2]),markersize = 85)
    line, = ax.plot([0.5],[1.5],marker = "s",color = cm.jet(V[i][3]),markersize = 85)
    line, = ax.plot([1.5],[1.5],marker = "s",color = cm.jet(V[i][4]),markersize = 85)
    line, = ax.plot([2.5],[1.5],marker = "s",color = cm.jet(V[i][5]),markersize = 85)
    line, = ax.plot([0.5],[0.5],marker = "s",color = cm.jet(V[i][6]),markersize = 85)
    line, = ax.plot([1.5],[0.5],marker = "s",color = cm.jet(V[i][7]),markersize = 85)
    line, = ax.plot([2.5],[0.5],marker = "s",color = cm.jet(1.0),markersize = 85)
anim = animation.FuncAnimation(fig,animate,init_func = init,frames = len(V),interval = 200,repeat = False)
HTML(anim.to_jshtml())


